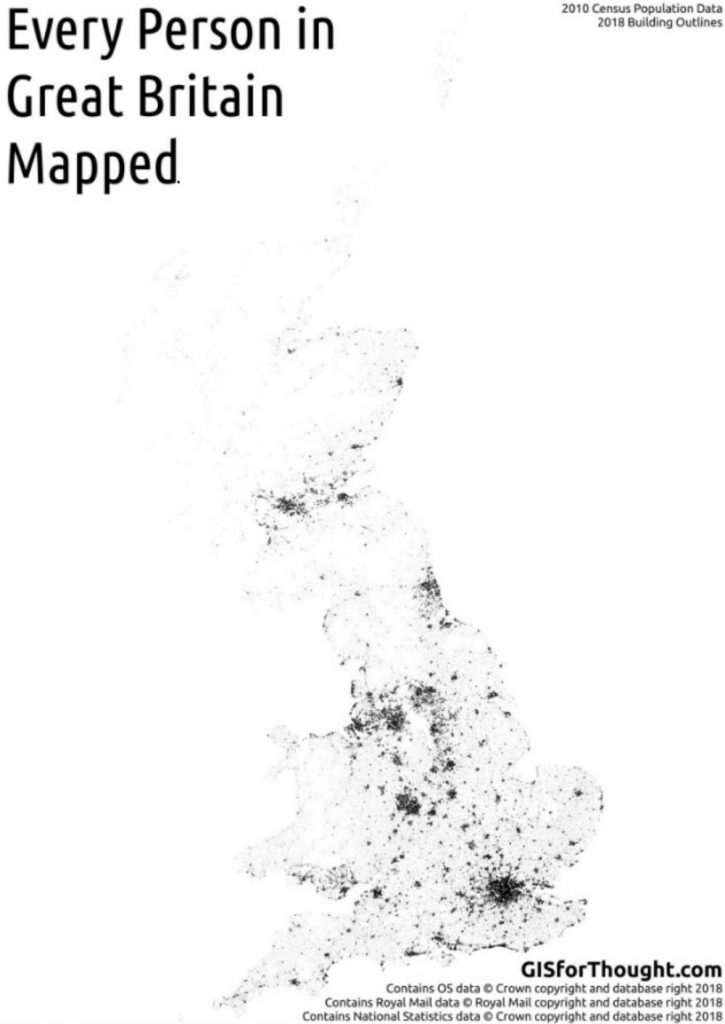
THE creator of a remarkable new map claims to show the position of every one of the UK’s 62 million citizens.
The map, which is based on the most recent census data, uses a black dot for every individual in Great Britain.
Zoomed out, the interactive map shows a diagonal line of dense development roughly from Newcastle to Cardiff.
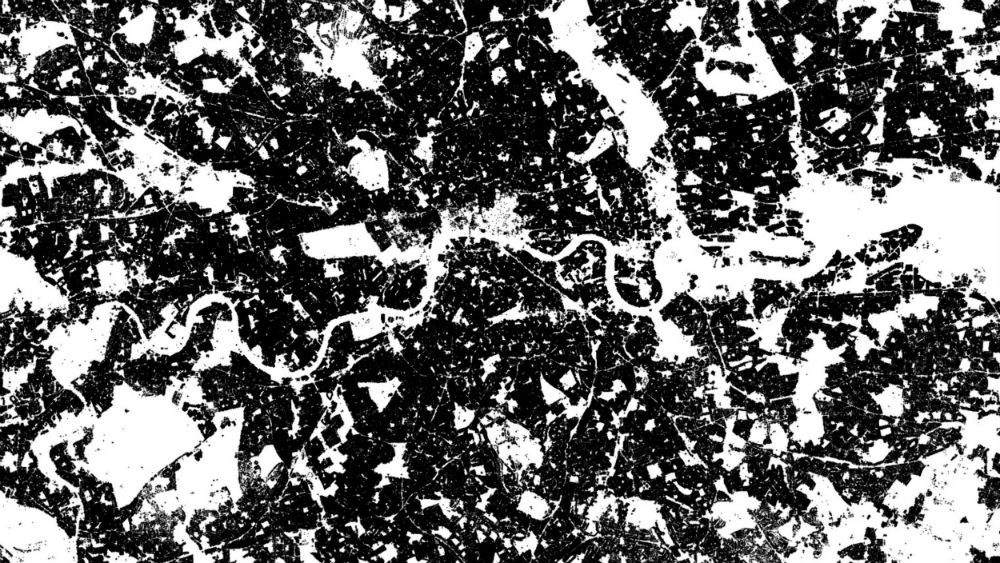
But zoom right in and it’s possible to spot the residents of Buckingham Palace. In nearby Downing Street, a pair of dots could be the Prime Minister and Chancellor of the Exchequer.
The map was created, not by a Briton, but by 31-year-old Finn, Heikki Vesanto.
Heikki who currently lives in Ireland used information from the National Records of Scotland and the Office of National Statistics (ONS) in order to get the latest census data from England, Scotland and Wales.
The ONS postcode directory and the Ordnance Survey open map were used to map people and the buildings in which they live.
Spatial analysit Heikki shared his map on Tuesday via twitter saying “Every person in Great Britain mapped. Around 62 million points.”
When zooming in on the map the outline of Buckingham Palace becomes clear as it is surrounded by many dots, one of which is likely to be Her Majesty The Queen.
Just under one kilometre away is Downing Street with two lonely dots clealy visible suggesting they could be the occupants of Numbers 10 and 11.
A dot identified on Shetland near the Hermaness Natural Nature Reserve in Shetland is thought to be the most northenly resident, and a dot near St Agnes in the Isles of Scilly is thought to be the most southernly resident.
The map distinctly shows how the east and south east of England are speckled grey throughout, demonstrating high population density.
In contrast the North West – with the exception Manchester and Liverpool – south west England and much of Wales have large areas of white patches where people do not appear to be living.
Another key identifier is the outline of national parks amidst high density populations across Great Britain. The Peak District for instance can be easily spotted between Manchester and Leeds.
The same can be said for the Dartmoor National Park in the south east, the Brecon Beacons in Wales, and the Lake District and Yorkshire Dales on the North of England.
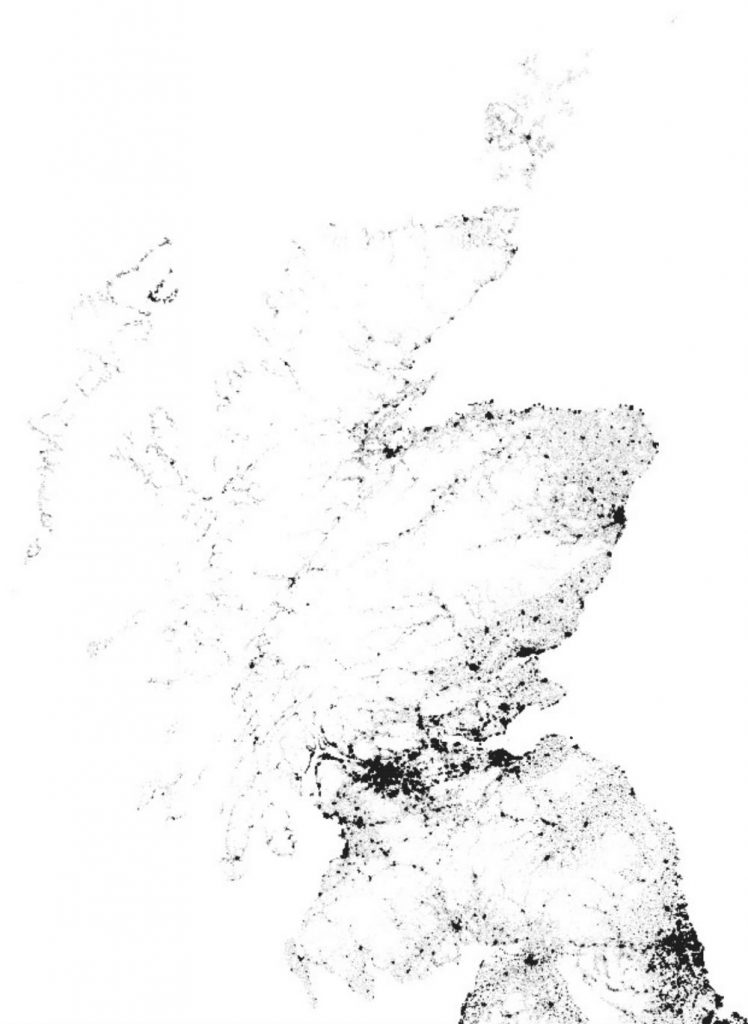
In Scotland, the map clearly identifies the central belt as home to at least two million of the country’s population of just over five million.
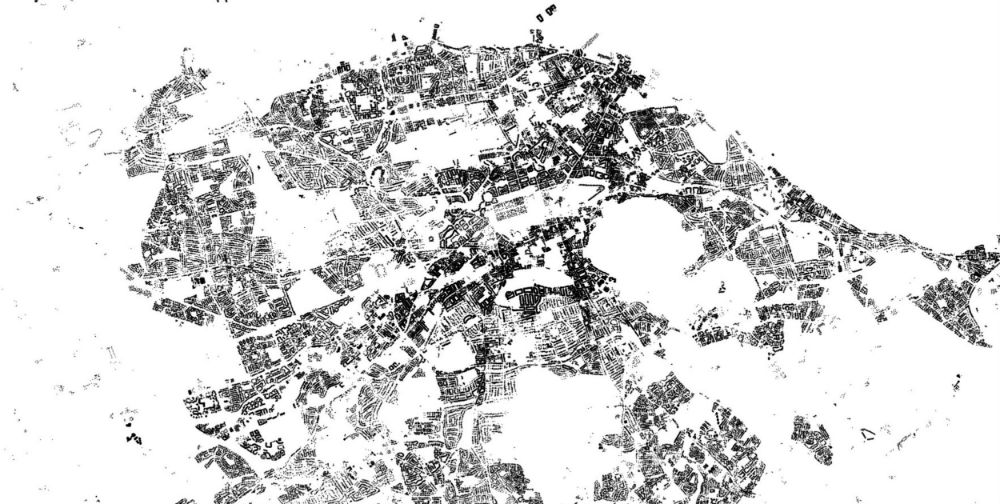
On closer inspection you can clearly identify the street patterns, parks, and rivers of big cities such as London, Edinburgh, Glasgow and Manchester.
The map is so detailed that viewers can even identify their own houses.
The interactive map was also shared on reddit where it has produced a lot of fans.
Bearhandsbearhands said: “I found my house on the interactive one.”
Some_dawid_guy added: “It’s awesome how well this outlines the coasts of Britain!
“You can tell that there isn’t an outline of Britain overlaid with the spots because of The Wash, where no one lives on it’s coast. Great map.”
Thekev506 wrote: “Interesting to see that the M62 corridor is the only area that comes close to the density of London.”
Heikki today said that the interactive map was a follow-up to his one of Scotland back in 2016.
He said: “It’s a follow up piece to a map I made a few years ago with just Scotland. It’s essentially a guess of where people live. So if a postcode has 10 residents according to the census. I put 10 points on the map randomly in buildings in that postcode.”
The interactive map can be viewed as a whole through this link
